What is an Empathy map?

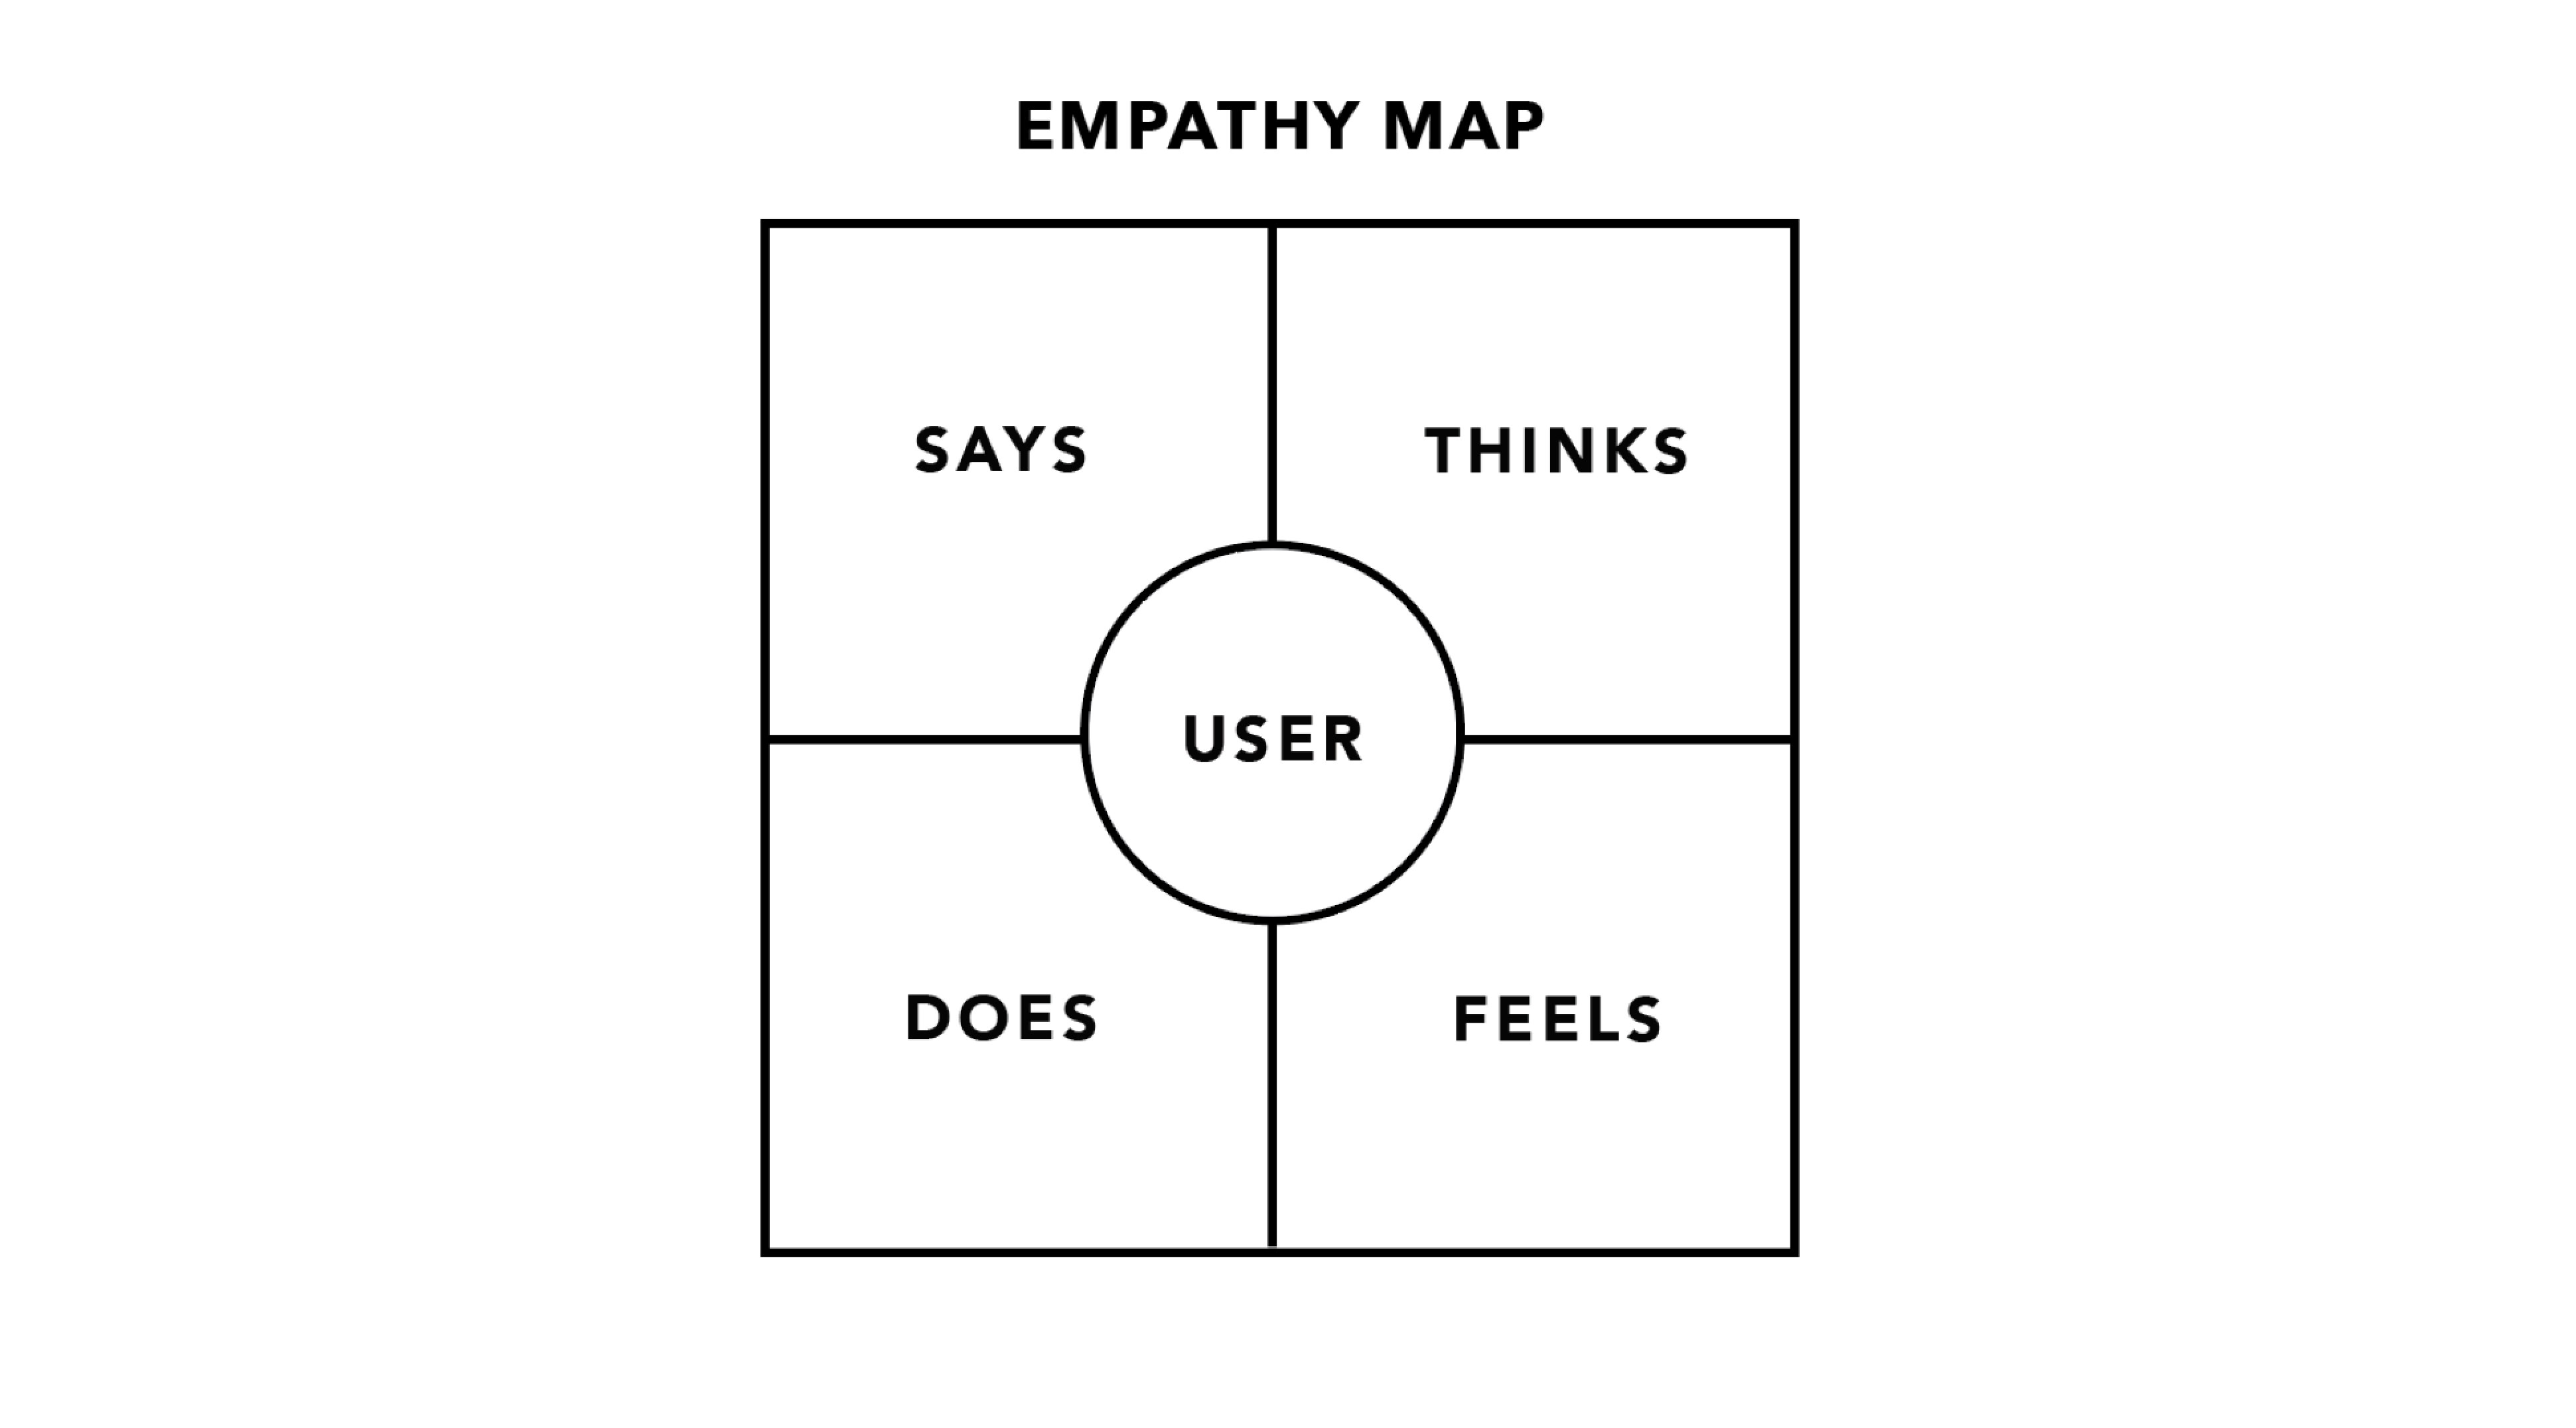
The empathy map is an easy-to-understand diagram that explains everything designers have learned about a particular type of user. An empathy map consists of four squares that show what the user says, does, thinks, and feels. The word user is in the middle right where these squares intersect.
Build an empathy map?
Traditional empathy maps are split into 4 quadrants (Says, Thinks, Does, and Feels), with the user or persona in the middle. Empathy maps provide a glance into who a user is as a whole and are not chronological or sequential.
To start building an empathy map, follow these steps:
Add the name of the user. Add the name of the person you interviewed to your empathy map. The name is helpful if you need to look at the original transcript or research, and it distinguishes this map from other maps you create.
The "SAYS" field. Use verbatim quotes from the interview. In other words, write down exactly what the person said, and don't summarize it in your own words. If you summarize a quote, you may inadvertently misinterpret the user's meaning. It's also helpful if you try to capture themes from the interview that relate to the product you're researching. For example, if the user repeats the same problem multiple times during the interview, it's likely a major pain point. Pay particular attention to the challenges the user mentions, and note any desired benefits or expectations they mention.
The "THINKS" field. This is where you can summarize the thoughts expressed by the user. Include feelings that the user expressed through body language, tone of voice, or other salient indicators, even if they didn't express them verbally to you. You can draw inferences for some of these feelings, but you must be careful not to make assumptions about the user. If you find contradictions, you can always ask your user for an explanation of their body language
The "DOES" square. Actions belong in the "DOES" square.
The "FEELS" square. List the feelings that the user is expressing. The notes you record may overlap with what you listed in the "THINKS" square. This process is meant to be a thorough documentation of your observations. If you're the person conducting the interview, you may notice signs of emotion such as anger, frustration, excitement, and others. If the user doesn't specifically mention any feelings during the interview, you can ask about feelings by asking, "How does this make you feel?"
-
keywords
- #Says
- #Thinks
- #Does
- #Feels
Types of empathy maps
It's important to know that there are two types of empathy maps:
Single-user empathy maps and aggregated empathy maps (also known as "multiple-user empathy maps")
Single-user empathy maps are created by converting a user's interview transcript into an empathy map. This approach helps designers put the thoughts, feelings, and characteristics of a single user into a format that facilitates data collection.
The other type of empathy map, an aggregated empathy map, represents a group of users who share similar thoughts, opinions, or characteristics. Aggregated empathy maps are created by taking interview transcripts and creating multiple empathy maps for a user, then combining the maps in which users expressed similar things into a new empathy map. This helps designers identify segments or groups of people with similar tendencies who'll use the product. The insights in the aggregated empathy maps allow designers to identify themes that help them better empathize with the groups they're designing for.
-
keywords
- #SingleMap
- #AggregatedMap